

Org chart software turns your people data into an organization chart that stays current: who reports to whom, how departments and offices are structured, and who leads each team. Good org chart software builds the chart from your HR systems and Microsoft Entra ID instead of a drawing, so it changes when people change. It also shows functional reporting lines, charts cross-functional teams, and works where people already look for colleagues.
This guide is for teams choosing a tool in 2027. First, it shows what the software adds to a drawing, an HR system, and the org chart Microsoft 365 already provides. Then it covers the features to test, matrix reporting, and AI agents in the chart. It also explains charts for cross-functional teams, export to Microsoft PowerPoint, keeping the data current, how the options compare, and pricing. Looking for a directory as well? Read our guide to employee directory software.
What org chart software adds to the tools you have
Most organizations already have an org chart somewhere: in a slide, a diagram, an HR system, or Microsoft 365. Org chart software doesn’t replace the systems that hold your people data. Instead, it draws the chart from them, keeps it current, and makes it useful to everyone.
Compared with a drawing or a slide
A chart drawn in Microsoft Visio or Microsoft PowerPoint looks finished on the day it’s published. However, every hire, move, and departure means someone has to redraw a box. Some diagram tools build the chart from a spreadsheet, but then someone has to keep the spreadsheet current by hand. Either way, the chart shows one day, and nobody can open a colleague’s profile from it. With org chart software, the slide becomes an export of the current chart instead of the master copy.
Compared with an HR system’s org chart
Many HR systems include an org chart, built from their own records. It’s current for the people that system holds. Larger or merged organizations, however, often run several HR systems, so each chart shows only part of the organization. In addition, the chart lives in the HR system, while colleagues look for each other in Microsoft Teams and Microsoft Outlook.
Compared with the org chart in Microsoft 365
Microsoft 365 already shows reporting lines. Profile cards show a person’s manager, and Microsoft Org Explorer lets people browse the manager chain, peers, and direct and indirect reports around a colleague.1 Microsoft 365 can also show dotted-line managers and other relationships when they arrive through people data connectors.2
However, both views are only as current as the data behind them. The manager usually comes from Microsoft Entra ID, where HR facts sit in a system IT owns.3 No access decision depends on that field, so no process, owner, or trigger keeps it current unless an HR system feeds it. Org chart software that keeps Microsoft Entra ID current therefore improves Microsoft’s own views too. Read why Microsoft Entra ID alone doesn’t give an accurate org view.
Features to look for in org chart software
A demo chart is always tidy. The real test, however, is your own organization, with its vacancies, matrix lines, and recent moves. So use the tables below as a checklist, and bring a real branch of your organization and one of its project teams to every demo.
Seeing the structure
| Feature | Why it matters | How to test it |
|---|---|---|
| Built from your data, not drawn | A chart drawn by hand starts to age the day it’s published | Change a manager in the source system, then check when the chart shows it |
| Direct and functional reporting lines | In a matrix, many people have a functional manager next to their line manager | Show one person with both managers, and check that nobody can confuse the two lines |
| Department and office hierarchies | People also ask which unit sits where, and who leads it | Open a department and an office, and see where each one sits in the structure |
| Navigation in large charts | Nobody reads a chart of thousands of boxes | Find a person deep in the hierarchy, then follow the path back to the top |
| From the chart to the person | A box only helps if it leads somewhere | Open a profile from the chart, then start a chat or a call from it |
| AI agents beside their owners | Agents now have their own identities, owners, and sponsors | Show an agent next to the person accountable for it, apart from human reports |
| Charts for cross-functional teams | Projects and committees cut across departments | Chart five colleagues from three departments, with their managers and reports |
| Editable export to Microsoft PowerPoint | Leaders still present the organization in slides | Export a chart, then edit a job title and move a card on the slide |
Keeping the chart current and governed
| Feature | Why it matters | How to test it |
|---|---|---|
| Several HR sources and Microsoft Entra ID | Larger organizations run more than one HR system | Import a file from each HR system, then see how the tool matches people and who approves the result |
| Data quality checks | A chart is only as current as its manager fields | Before the first sync, check your Microsoft Entra ID data for missing managers and department heads |
| Field-level governance | Not every field suits every audience | Hide a field from one audience, then check what a regular employee sees |
| Lines that don’t rely on color | Color alone excludes some readers | Check that direct and functional lines differ by pattern, not only by color |
Four topics need extra attention: matrix reporting, AI agents, cross-functional teams, and export to Microsoft PowerPoint. Each has its own section below.
Matrix reporting: show both lines in the org chart
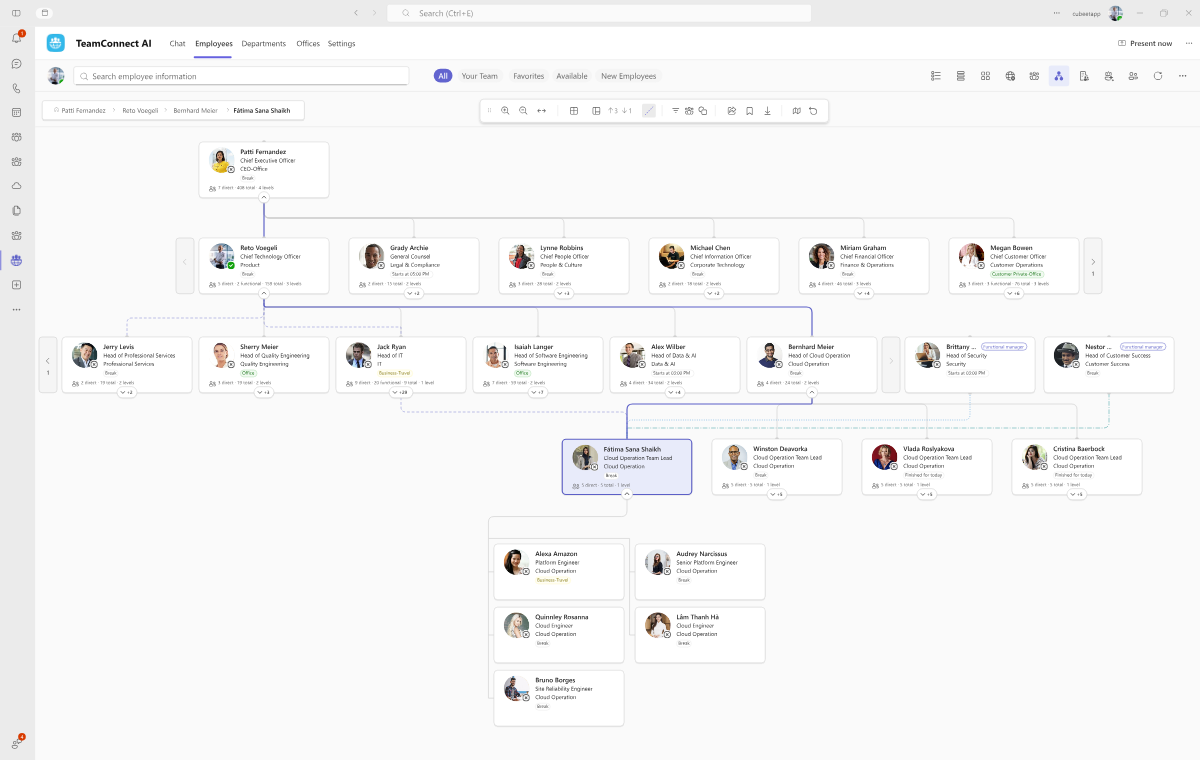
In a matrix organization, a person reports to a line manager and also works for a functional or project manager. For example, a sales engineer in Singapore may report to the country manager and take technical direction from a global practice lead. An org chart that shows only one of those lines answers half the question.
Good org chart software therefore keeps the two kinds of relationship apart. A solid line means direct reporting, a dashed line means a functional relationship, and a legend says so. It also doesn’t infer reporting lines from job titles, because a global director may lead a function without managing everyone in it. Instead, the chart shows recorded relationships and makes gaps visible.
Counting rules matter as well. A person shown under two managers is still one person, so headcount and span of control should count the direct line only. Read how to build a matrix org chart that survives its first reorganization.
AI agents in the org chart
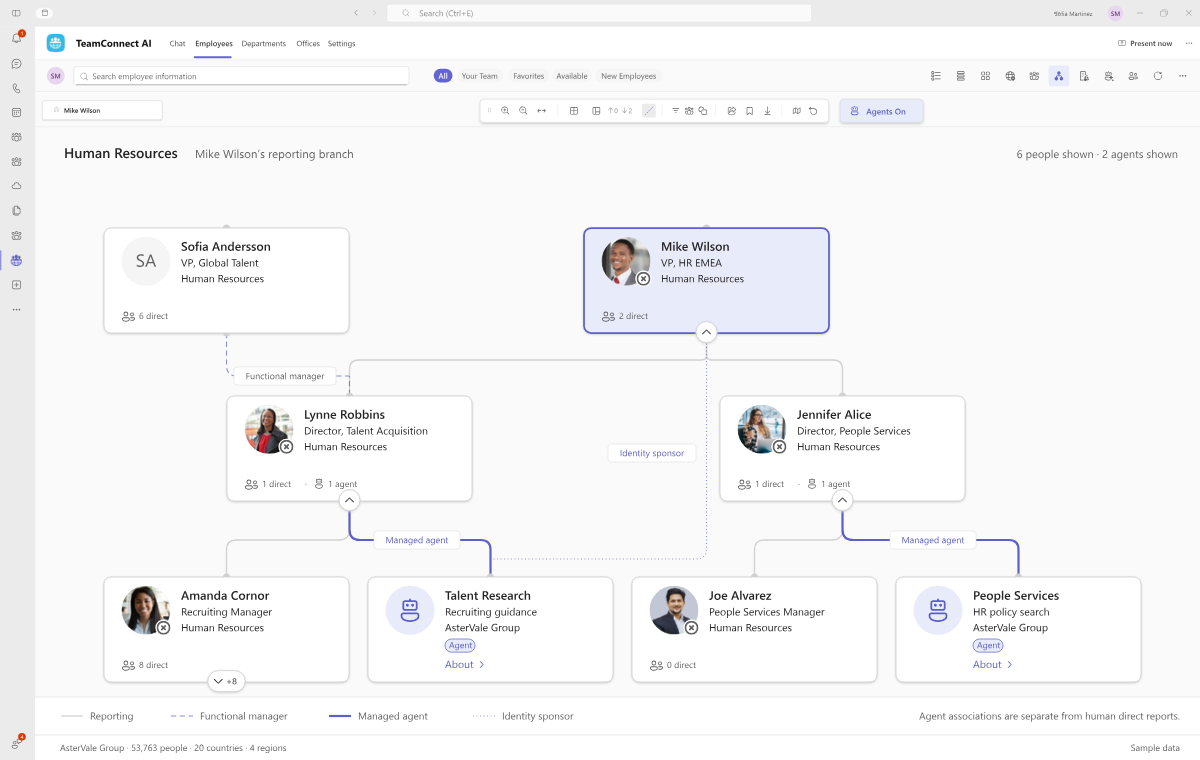
AI agents now get their own identities in Microsoft Entra Agent ID, with an owner, a sponsor, and a description of what they can do. People need to know which agent can help them and who is accountable for it, so the org chart should show agents too. However, an agent is not an employee.
So look for three things. First, agents appear beside the people accountable for them. Second, the chart draws agent relationships separately from human reporting lines. Third, agents stay out of headcount. An agent’s capability describes what it does, and it’s never a human skill. Read how to put AI agents in the organization without losing human accountability.
Org chart software for cross-functional teams
Much of the work in an organization happens in groups that cut across the hierarchy, such as an agile team, a product launch, a project, or a steering committee. Their members sit in different departments and countries, and sometimes in different HR systems. A classic org chart, however, shows one branch at a time.
Where Circles come from: agile, cross-functional teams
Agile organizations work this way on purpose. McKinsey describes an agile organization as a network of teams that learns and decides in fast cycles, with teams assembled and dissolved as the work changes.4 Self-managing models such as sociocracy and Holacracy organize work in circles, built around an area of work or a purpose rather than a reporting line.56
Most organizations, however, keep their hierarchy and add teams to it. In Deloitte’s 2019 survey, 8 percent of respondents said their organizations operate almost wholly in teams, and another 23 percent said most work happens in teams within a hierarchy.7 So people keep a department and a line manager, while much of their daily work happens in teams across departments.
What org chart software should show for dynamic teams
A classic org chart shows the hierarchy, not the teams. Deloitte describes a company organized into 14 functional units, while its people actually worked in four teams.7 Because teams form, change, and dissolve as the work changes, a chart drawn for them soon goes stale. Yet every team needs answers that only the hierarchy holds, such as whom each member reports to.
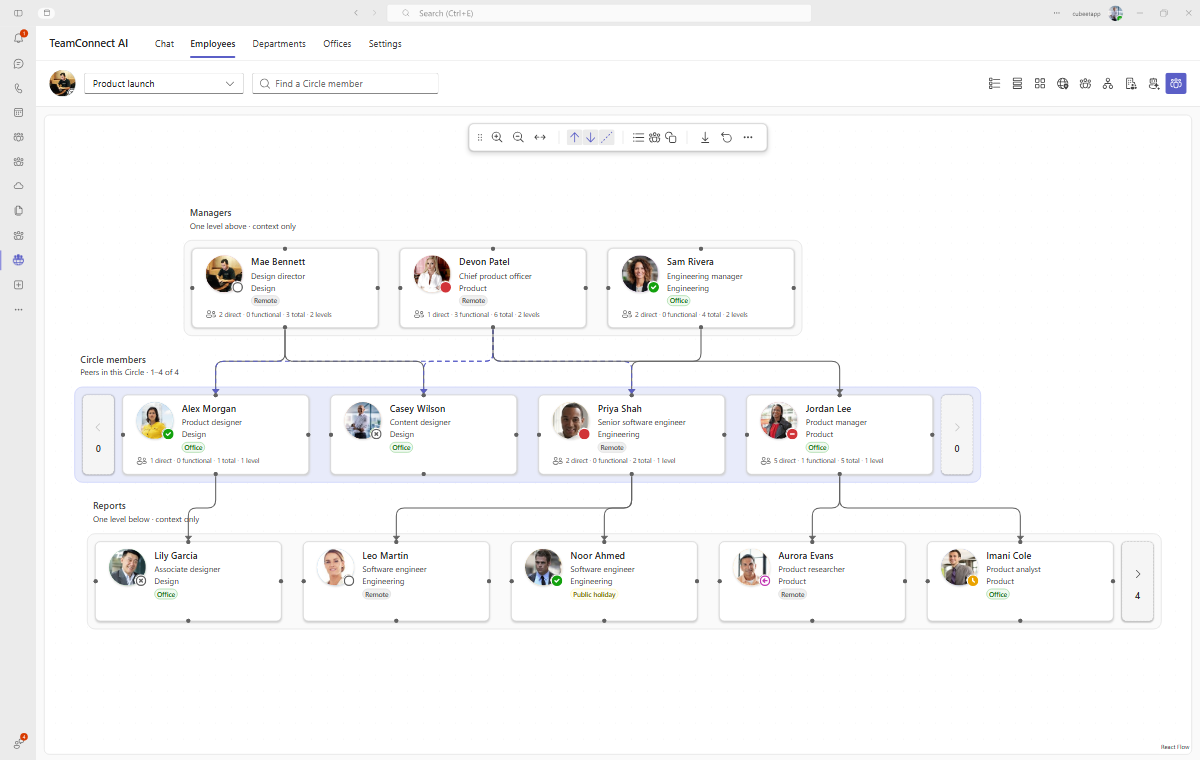
So look for org chart software that charts any group of people, not only a department. TeamConnect AI calls this a Circle org chart. A Circle is a saved group of the people you work with. Its org chart places the members side by side on one level, without appointing a Circle leader, and a reporting line between two members stays visible. Above each member, the chart shows their manager, and below, their direct reports. One view then answers four questions:
- Who is in the team, across departments and countries?
- Whom does each member report to, including functional managers where your data governance allows it?
- Who supports each member?
- Who is available right now, and where does each person work today?
When the same person appears twice, for example as one member’s manager and another member’s report, the chart marks both places and counts the person once.
Export the org chart to Microsoft PowerPoint
Even with a live org chart, the organization still appears in slides: in a board pack, a project kickoff, or a reorganization announcement. A screenshot pasted into Microsoft PowerPoint is quick. However, nobody can then change a job title or move a box on the slide.
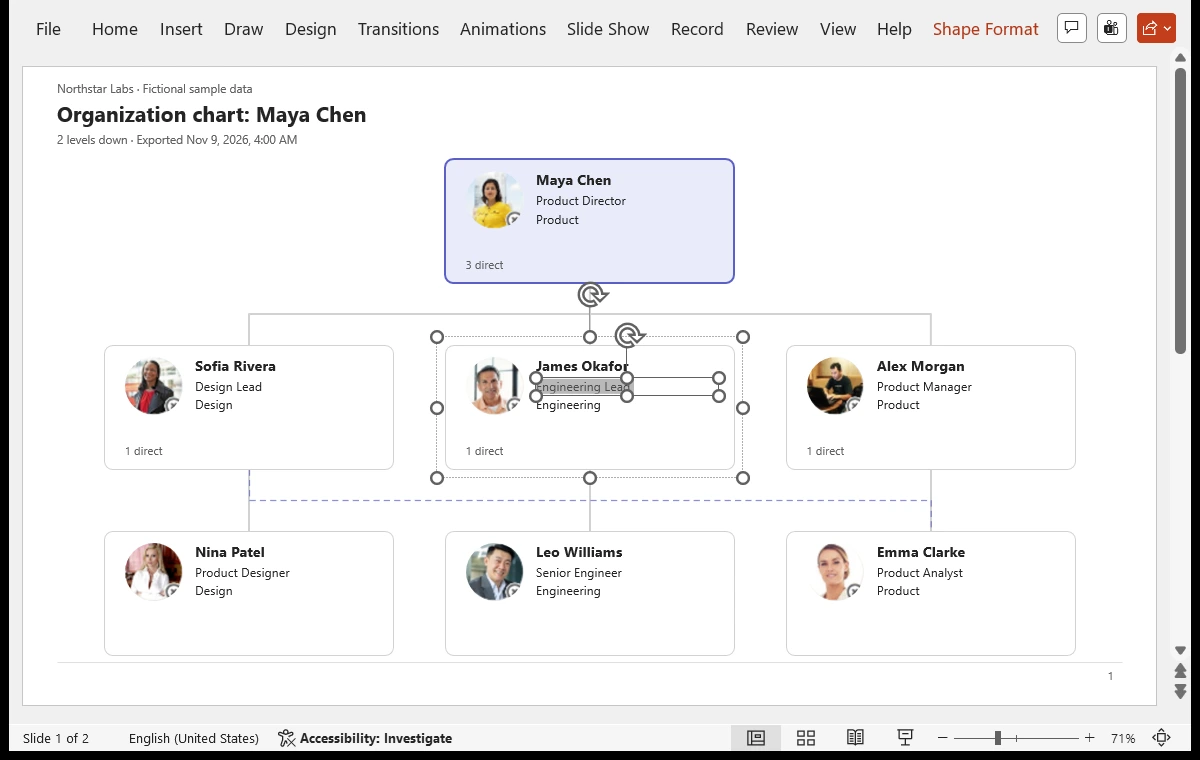
Therefore, look for an export that builds the chart from native shapes in Microsoft PowerPoint. Each card and its text stay editable, photos stay pictures, and the reporting lines stay attached when you move a card. For a large chart, look for an overview slide with readable detail slides, rather than one slide with tiny text. In addition, you’ll want PDF and print for documents, and PNG for chats and wikis.
Also check what an export contains. Because the file leaves the app, it should show only the fields that the person exporting may see. After that, it’s a copy: it doesn’t update when the chart changes or enforce permissions, so handle it like any document with personal data.
How to keep an org chart current
An org chart goes stale for a structural reason, not because anyone made a mistake. The manager, department, and office fields are HR data kept in Microsoft Entra ID, a system IT owns, and nothing breaks for IT when they go stale. An HR system can feed them through HR-driven provisioning, but someone has to set up that connection for each HR system.8
Four habits keep the chart current:
- Give each kind of reporting line an owner, usually HR for direct lines and the functional leaders for functional ones.
- Check the data before the first sync, including people without a manager and departments without a head.
- Bring in changes from every HR system on a schedule, so joiners, movers, and leavers reach the chart.
- Review exceptions such as vacancies, acting managers, and very large spans of control.
After a merger or an acquisition, the same habits apply to two organizations at once. Read how to make reporting-line accuracy an owned service, and how to publish the organization you can defend after an acquisition.
Five ways to make an org chart, compared
Organizations usually move through five options as they grow. The table compares them on what matters most: effort, currency, matrix reporting, and who can use the chart. Our guide also explains how the org chart and the employee directory work together.
| Option | Upfront effort | Stays current | Matrix reporting | Who uses it |
|---|---|---|---|---|
| Slide or diagram | Low | No, redrawn by hand | Drawn by hand | Whoever receives the file |
| Diagram built from a spreadsheet | Low | Only as current as the spreadsheet | Limited | Whoever receives the file |
| HR system org chart | None, if already licensed | Yes, for the people in that system | Depends on the system | People with access to that HR system |
| Microsoft 365 built-ins | None, already licensed | Only as current as Microsoft Entra ID and your connectors | With people data connectors | Everyone in your Microsoft 365 |
| Org chart software | A purchase and a rollout | Yes, through scheduled imports and sync | Depends on the tool, so test it | Everyone you license |
A small team that rarely changes may do fine with a diagram. But if you run several HR systems, work in a matrix, or reorganize often, org chart software usually pays off.
Pricing models for org chart software
Most org chart software charges per user, per month or per year. However, the user differs: some tools count the people shown in the chart, others the people who edit it, and others everyone who signs in. So ask three questions before you compare prices:
- Who counts. Does every person in the chart need a license, or only those who sign in?
- What is included. Are the employee directory, HR connectors, and AI part of the plan, or extras?
- How you buy. Microsoft bills apps sold through Microsoft Marketplace or the Microsoft Teams Store, together with your other Microsoft purchases.
For TeamConnect AI plans and prices, see pricing and talk to our sales team.
Security questions to ask an org chart software vendor
Reporting lines are personal data, and an org chart shows them to the whole organization. So ask each vendor these six questions:
- Where is the chart’s data stored, and who controls its retention and backup?
- Which permissions does the app request at admin consent, and why does it need each one?
- Can you hide a field, such as a mobile number, from one audience while showing it to another?
- Does the app write manager changes back to Microsoft Entra ID, and who chooses which fields?
- How does the app mark AI agents, so they never appear as human reports?
- Does an export show only the fields that the person exporting may see?
For TeamConnect AI, your people and organization records are stored in SharePoint Online within your own Microsoft 365 tenant, so your own retention policies, backup, and audit apply. Installation takes two global admin consents, and administrators choose which fields the app writes back to Microsoft Entra ID. Exports follow the chart’s Data Governance rules and include only the fields and reporting relationships the person exporting may see. For more questions, see what to look for in employee directory software.
TeamConnect AI: org chart software for Microsoft 365
TeamConnect AI by Cubeet is the AI employee directory for Microsoft Teams, Microsoft Outlook, and Microsoft Copilot, and its org chart is part of it. It consolidates people data from your HR systems and Microsoft Entra ID into three linked directories, for employees, departments, and offices, and draws the org chart from them.
Direct and functional reporting lines
The org chart shows job roles, functions, organizational levels, and direct and functional reporting relationships across the employee, department, and office hierarchies. Solid lines mark direct reports, and dashed lines mark functional ones. When you select a person, the chart highlights their path through the hierarchy, with a breadcrumb trail. See how TeamConnect AI makes matrix reporting explain authority.
Circle org charts for the people you work with
You build a Circle in Collaboration from people you pick, your favorites, Your Team (your managers and reports), a department, a team in Microsoft Teams, or a group chat. A Circle keeps its members until you change them. Pin the Circles you use most, or share one with selected colleagues. Each of them sees it among their saved Circles, within their own directory permissions. Large Circles have pages, a search, and a full member list. In Microsoft Teams on a phone, the members appear in a row of photos, and selecting one shows their card with their manager and reports.
Select a member and turn on Works with to see the colleagues Microsoft 365 ranks as most relevant to that person, in Microsoft’s own order. Other members of the Circle carry an In this Circle mark, which doesn’t change the order. Microsoft 365 bases the ranking on communication and collaboration patterns, and it includes only relationships that are already public, such as people who share a manager.9 So it’s a relevance order, not a measure of how closely people work together. In Data Governance, administrators can turn these insights off, limit them to each viewer and their direct reports, or hide executives’ networks.
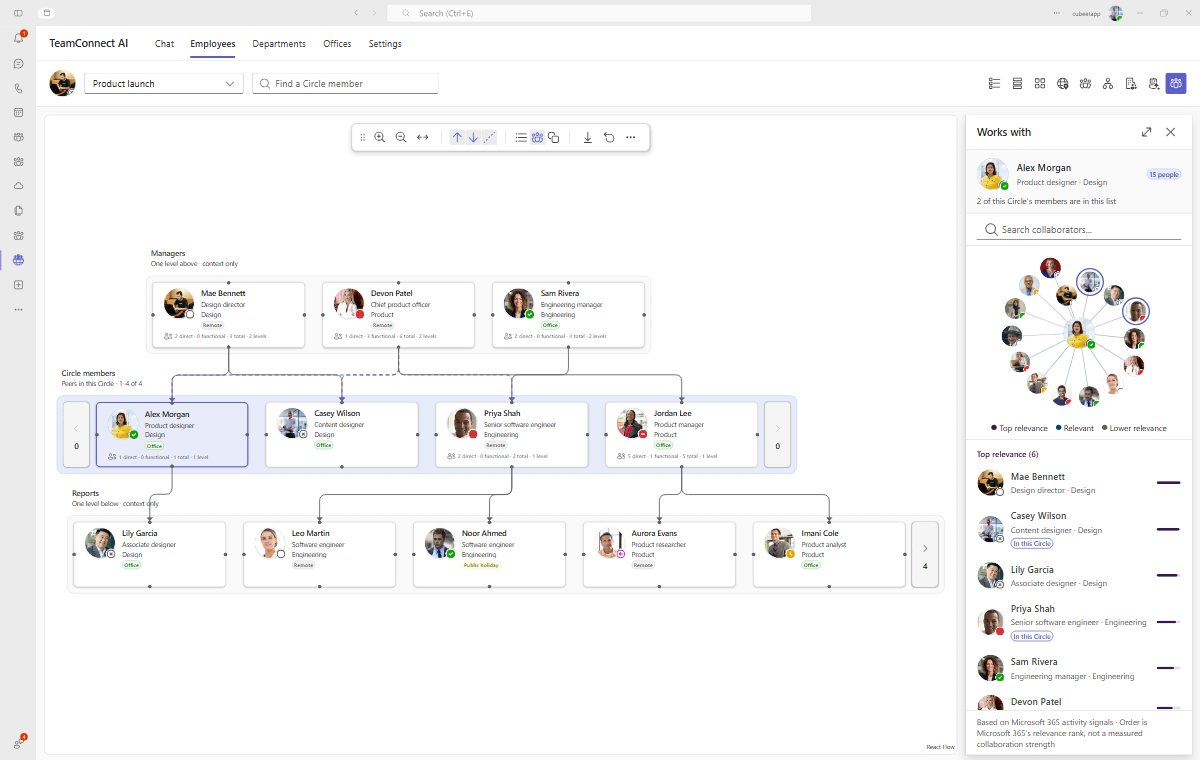
From the org chart to the person
Open a profile from the org chart to see the person behind the position. Then Instant Connect starts the chat, call, or meeting, and every step happens inside your Microsoft 365. For work and project experience, people ask the AI agent in plain words. Watch the org chart in Microsoft Teams on video.
Digital workers beside their owners
Managed agents appear in the org chart as digital workers next to the people accountable for them. Their associations stay separate from human reporting lines, so the chart shows who runs a digital worker without pretending it reports like an employee.
Print, PDF, PNG, and editable Microsoft PowerPoint
Export employee, department, office, and Circle org charts as PDF, PNG, or editable Microsoft PowerPoint, or print them where supported. The .pptx file keeps cards, text, photos, and reporting lines editable, and functional lines keep their dashes. Large charts get an overview slide and readable detail slides. Each export covers the chart you have open and follows its Data Governance rules. As a result, a slide for the board starts from today’s chart instead of a redrawing.
Current data from your HR systems and Microsoft Entra ID
Before the first sync, IT runs the Microsoft Entra ID Health Check, which scores the data in seven categories, including managers and department managers. HR then imports data from several HR systems through the Employee Import Hub, or connects them through the Integration Hub and its 50+ connector templates. A bi-directional sync with Microsoft Entra ID keeps Microsoft 365 current. Administrators choose which fields the sync writes back, so profile cards and Microsoft Org Explorer can show the same managers as the org chart.
Shape what each audience sees
Use Data Governance to decide which audience sees each field across the three directories. You can also hide fields, change their order, and add up to 240 custom fields to each directory. See everything in TeamConnect AI.

How to get started with org chart software
A chart is only as current as its sources, so start with the data. The steps below follow the order we recommend for TeamConnect AI, and most of them also apply to any tool:
- Choose the scope: the whole organization, or one country or company to begin with.
- Check and sync Microsoft Entra ID: IT runs the Microsoft Entra ID Health Check, then the sync. With current managers in Microsoft Entra ID, the sync alone builds the chart.
- Add functional managers: import them from your HR systems, together with the other HR data you need.
- Review exceptions: people without a manager, departments without a head, and very large spans of control.
- Run it as a service: give each kind of reporting line an owner, and schedule imports and syncs.
Installation itself takes two global admin consents. The app then creates the Microsoft SharePoint site collections it needs within one to two minutes. To see your own org chart in TeamConnect AI, book a demo.
Frequently asked questions about org chart software
What is org chart software?
Org chart software creates an organization chart from your people data instead of a drawing. It shows reporting lines, departments, and offices, and it keeps the chart current as people join, move, and leave. People can also open a colleague’s profile from the chart. Some tools show functional reporting lines and AI agents as well.
Does Microsoft 365 have an org chart?
Yes. Profile cards show a person’s manager, and Microsoft Org Explorer lets people browse the structure around a colleague in Microsoft Teams, Microsoft Outlook, and Microsoft 365. Both read reporting lines from Microsoft Entra ID or from people data connectors, so they’re only as current as that data.
How do you show dotted-line reporting in an org chart?
Record the functional relationship as its own type, with an owner, and draw it differently from direct reporting, for example as a dashed line with a legend. Don’t infer it from job titles. In TeamConnect AI, functional managers come from your HR data and appear as dashed lines next to the solid direct lines.
What is a Circle org chart?
A Circle org chart shows a Circle: a saved group of people who work together across the hierarchy, such as an agile team, a project, or a launch team. Self-managing organizations have long organized work in circles, and agile organizations in cross-functional teams. TeamConnect AI shows the members on one level, without appointing a Circle leader, with each member’s manager above and direct reports below.
Can org chart software export to Microsoft PowerPoint?
Check the format first: a picture on a slide can’t be edited, while native shapes can. TeamConnect AI exports employee, department, office, and Circle org charts to an editable Microsoft PowerPoint file, with cards, text, photos, and attached reporting lines. Large charts get an overview and readable detail slides. You can also export to PDF or PNG, or print where supported.
How do you keep an org chart up to date?
Build it from your HR systems and Microsoft Entra ID instead of by hand, then schedule the imports and the sync. Also give each kind of reporting line an owner. Before the first sync, check the data for missing managers and department heads, and afterwards review exceptions regularly.
Can AI agents appear in an org chart?
Yes, if the software keeps them apart from people. In TeamConnect AI, managed agents appear beside the people accountable for them, and their associations stay separate from human reporting lines. As a result, an agent never looks like someone’s direct report.
What is the difference between an org chart and an employee directory?
The employee directory helps people find a colleague by name, skill, or location, while the org chart shows how people and units relate. They work best together, on the same data. Read more in our complete guide to the employee directory.
How much does org chart software cost?
Most tools charge per user, per month or per year. The total depends on who counts as a user, whether the directory and HR connectors are included, and how you buy. For TeamConnect AI, see pricing and talk to our sales team.
References
- Microsoft Learn: Introducing Org Explorer. 2026.
- Microsoft Learn: People relationships in Microsoft 365. 2026.
- Microsoft Learn: People data sources in Microsoft 365. 2026.
- McKinsey & Company: The five trademarks of agile organizations. 2018.
- Sociocracy For All: Gerard Endenburg, founder of the Sociocratic Circle Method and trailblazer of self-management.
- HolacracyOne: Organizational structure.
- Deloitte Insights: Organizational performance: It’s a team sport (2019 Global Human Capital Trends). 2019.
- Microsoft Learn: What is HR-driven provisioning? 2026.
- Microsoft Learn: Use the people API to get information about the people most relevant to you. 2026.