
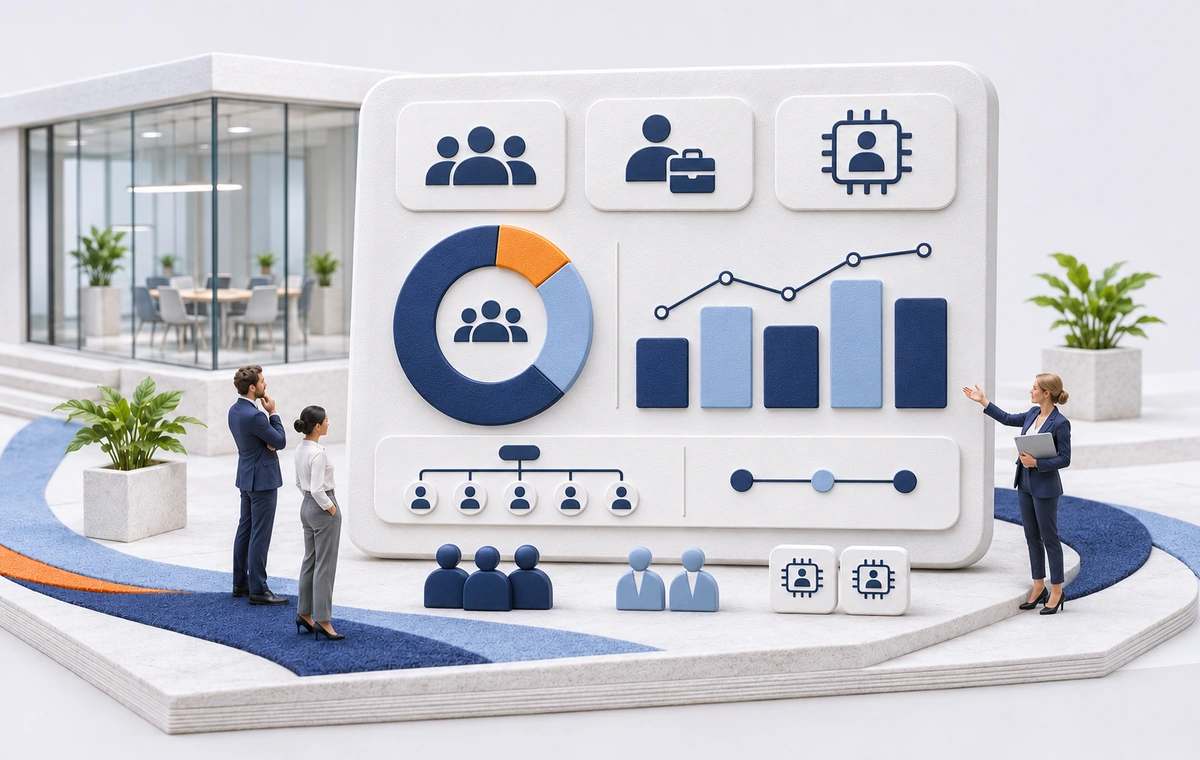
Workforce analytics software turns the data you hold about your workforce into answers. How many people work for us? In which countries and departments? What does that capacity cost, and how did it change since last quarter?
The name sounds precise, but it is used for three different kinds of tools. In fact, each kind answers a different question for a different person. This guide first explains the three types, then lists what to check before you buy, and finally shows where reporting stops and planning starts.
What is workforce analytics software?
Workforce analytics software collects data about the people who do an organization’s work and reports on it. The data comes from HR systems, identity systems, purchasing, and sometimes from the devices people work on. The reports then go to HR, Finance, IT, and executive management.
Good workforce analysis starts with a clear question. “How large is our workforce?” needs different data than “Why do people leave?” or “How is working time spent?” Therefore, software built for one of these questions rarely answers the other two well.
The three types of workforce analytics
1. Organization analytics
This type of workforce analytics software answers how large the workforce is, who makes it up, what it costs, and how many people join and leave. It reports headcount and FTE for employees, the external workforce, and, more and more often, digital workers (AI agents that do work next to people). It also breaks the numbers down by division, country, legal entity, cost center, department, or job role, and it shows how they change over time.
Typical readers are the executive team, Finance, and HR. HR is usually the team asked to deliver it. Typical questions: Where did we grow? What happened after the reduction we announced? Did external workforce go up when employee FTE went down?
2. People analytics
This type looks at the employee lifecycle: hiring, engagement, performance, development, and why people leave. It often works with survey results and HR case data, and some tools predict outcomes such as the risk that someone leaves.
Typical readers are HR leaders and HR business partners. Typical questions: Why do people leave? Which hiring channels work? Where are skills missing?
3. Activity and productivity analytics
This type measures how working time is spent. It collects data from computers and applications, such as which programs are in use and for how long.
Typical readers are operations and team managers. Typical questions: Where does time go? Which tools are in use? Because this type records individual behavior, check early with your works council, your legal team, and the data protection rules in each country.
The HR metrics workforce analytics should report
For organization analytics, workforce analytics software should report these metrics:
- Headcount: the number of people, counted once each.
- FTE: the capacity those people represent. For example, one full-time employee is 1.0, while someone working 60% is 0.6. Read more in headcount and FTE are different denominators.
- External workforce: contractors and other people who work for you without being employees, in headcount and FTE.
- Digital workers: the AI agents that do work in your organization, as a number and as a cost.
- Total workforce: employees plus external workforce.
- Joiners, movers, leavers, and turnover: who came, who moved within the organization, who left, and the turnover rate, for employees and external workforce, on the same dimensions as the numbers.
- Cost: what each group costs, on the same dimensions as the numbers.
- Change: what moved since last month or last quarter, and where.

Why the three groups belong in one report
The value is in seeing these side by side. Employee data usually sits with HR, often in several HR systems. External workforce data sits with purchasing, and digital workers with IT. So each owner reports on its own part. Someone still has to bring the parts together before the leadership team can read them as one picture.
The parts also move against each other. When employee FTE goes down by 10%, external FTE may go up by a similar number, and the cost may rise by more. External rates are often higher than employee cost, and external workforce is an operating expense, not payroll. Digital workers follow the same logic, because they add capacity and cost that no headcount report shows. As a result, a report that covers only one group cannot show what a decision really did.
Research points the same way. In a 2025 study for SAP, Economist Impact surveyed more than 2,000 C-suite executives; 64% plan to expand their talent networks within three to five years.1 Similarly, Microsoft’s 2025 Work Trend Index reports that 82% of leaders expect to use digital labor to expand their workforce within 12 to 18 months, and it names a new metric, the human-agent ratio.2 In addition, McKinsey wrote in June 2026 that workforce planning built on headcount alone no longer fits an organization where work is shared between people and AI agents.3
What to look for in workforce analytics software
Use the table below as a checklist, and bring your own questions to every demo.
| Check | What to ask |
|---|---|
| The question it answers | Which of the three types is this tool: organization analytics, people analytics, or activity analytics? Does that match the question you need answered? |
| The whole workforce | Does it cover employees, external workforce, and also digital workers, or employees only? |
| Your dimensions | Can you report by division, country, legal entity, cost center, department, and job role, and combine them? |
| Drill-down | Can you go from the total to a department and then on to the people behind a number? |
| Actual data and trends | Does it show what happened, from current and historical data, and also how each group developed? |
| Cost without salaries | Can it show cost without exposing anyone’s salary? |
| Several HR systems | If you run more than one HR system, how does the data come together, and how long does adding a system take? |
| Access by role | Who sees which report? For example, can you limit cost, or any other part, to the roles that need it? |
| Privacy | Does the tool hold data you do not want in a report, such as age or gender? Ask what the report shows when a filter leaves only a few people. |
| Exports | Can you take a report into a board deck or a spreadsheet without rebuilding it? |
| Time to the first report | Is this a business intelligence project with a data model to build, or rather a product that reports from data it already holds? |
| Where it runs | Does it work inside the tools your people already use, with the sign-in and security you already have? |
Workforce analytics and workforce planning are different jobs
Workforce analytics reports what is and what was. In contrast, workforce planning models what could be: scenarios, forecasts, and targets for the years ahead.
The two are often sold under one name, “workforce planning and analytics”. They are still different jobs with different owners. Analytics has to be right about today, every day. Planning, in contrast, has to be useful about a future nobody knows yet.
So decide which job you are buying workforce analytics software for. If the leadership team first needs to see the workforce as it is, across employees, external workforce, and digital workers, start with analytics. Otherwise, a plan built on a picture nobody trusts will be questioned in every meeting.
Workforce analytics for Microsoft 365 with TeamConnect AI
TeamConnect AI is an employee directory for Microsoft Teams. It consolidates people and organization data from your HR systems and Microsoft Entra ID. Organization Insights is the reporting dashboard built from that same data.
As workforce analytics software, it belongs to the first type in this guide: organization analytics. Organization Insights shows headcount, FTE, and estimated cost for employees, external workforce, and digital workers, side by side, on any organizational dimension. It also shows up to 36 months of history with trends, from the top of the organization down to the place where each change happened. You also see joiners, movers, leavers, and turnover, so you can tell whether cost and turnover move when external workforce or digital workers change. After a reduction, you therefore see where it landed, what it did to cost, and whether external workforce or digital workers grew in its place.
What that means in practice
- No business intelligence project. The import that builds the directory also feeds the dashboard.
- From the total to the person. You can drill down from a number to the people behind it.
- No salaries, no protected demographics. Cost is shown as estimated cost, and TeamConnect AI holds no age or gender data at all.
- Small groups protected. You set the group size below which details stay hidden, in line with your privacy policy.
- Governed by role. You decide by role and Microsoft 365 security group who sees each view, including cost and digital workers.
- Ready for the board. Reports export to Microsoft PowerPoint, PDF, Microsoft Excel, and CSV.
What it does not do: Organization Insights reports observed facts about how your organization changes, from your directory data. However, it does not forecast or run scenarios, and it is not a people analytics suite.
See how leaders use it on the pages for executive leaders and finance leaders, or read what to look for in employee directory software and org chart software.
Workforce analytics software FAQ
What is workforce analytics?
Workforce analytics is the practice of using data about an organization’s workforce to answer management questions. For example, it shows how large the workforce is, how it is spread across the organization, what it costs, and how it changes. Workforce analytics software then collects the data and produces the reports.
What are the types of workforce analytics?
There are three common types. Organization analytics reports workforce count, composition, cost, and turnover. People analytics studies hiring, engagement, performance, and why people leave. Activity and productivity analytics measures how working time is spent. However, many tools cover only one of them.
Is workforce analytics the same as people analytics?
Not quite. The two terms are often used for the same thing. In this guide, people analytics means the study of the employee lifecycle, such as hiring, engagement, and why people leave. Workforce analytics, however, is the wider term. It also covers the size, structure, and cost of the whole workforce, including people who are not employees.
Does workforce analytics software monitor employees?
Only one of the three types does. Activity and productivity analytics records how time is spent on computers and in applications. Organization analytics software, in contrast, reports on numbers, structure, and cost, and does not record individual activity. So ask every vendor which data the tool collects.
Does workforce analytics need salary data?
No. Cost can be reported without loading salaries into the tool. Still, ask each vendor how cost is shown and who can see it.
What is the difference between workforce analytics and workforce planning?
Workforce analytics reports what is and what was, from actual data. Workforce planning, however, models what could be, with scenarios and forecasts. Some suites offer both. Many organizations start with analytics, because a plan needs a trusted picture of today.
References
- SAP News Center: From Cost to Capability: Why External Talent Is Your Competitive Edge (on the Economist Impact study “From Cost to Capability: Redefining External Workforce Strategy in 2025”). 2025.
- Microsoft: The 2025 Annual Work Trend Index: The Frontier Firm is born. 2025.
- McKinsey & Company: HR’s dual mandate in the AI era. 2026.